Christof Schöch, from the University of Trier, Germany details how the DOAJ journal dataset is used at the University to teach Python programming for Machine Learning in a Digital Humanities Master’s program. Students learn practical skills like data cleaning, analysis, and classification. The real-world complexity of the dataset provides essential experience beyond simple “toy datasets” and serves to debunk common myths about open access.
Open science practices are an important aspect of Digital Humanities. Therefore, open access and the crucial role DOAJ plays for the documentation and dissemination of information about open access journals have a prominent place in the introductory module of our Master of Science Digital Humanities at Trier University, Germany. This post, however, is about another way in which the DOAJ plays a role in our curriculum: We are also using DOAJ’s regularly published dataset on the journals when teaching Python. This post explains how and why we do this, and what students can learn both about Python and about open access while interacting with the dataset. Finally, we can derive some recommendations for the dataset itself, based on our experience interacting with it.
Before diving into this topic, a short note for those who are not familiar with DOAJ’s dataset. This is a regularly updated, openly available, CC0-licensed CSV file that includes a wide range of detailed information about each of the well over 22,000 journals currently included in DOAJ’s database. There are even more detailed datasets available as well, but this CSV file already includes very rich information on the journals, including, but not limited to: when the journal started to publish in open access, what licenses it uses, keywords and subject headings that describe the journal’s scope, languages of publication, the name and country of the publisher, information on the review process, publication volume and speed (weeks from submission to publication), the use of persistent identifiers, as well as information on article processing charges (APCs), whether they are charged, and if so, what amount they are.
All in all, the dataset currently has 22,600 rows and 52 columns. This means it’s quite large, certainly too large for any manual fixing of problems, without being entirely overwhelming. For that reason, the DOAJ file is one of the key datasets that students in our class on Python programming for Machine Learning interact with. The immediate aim is to understand the dataset, to prepare it for use in a classification task, and to actually perform such a classification task. Beyond that, this means moving beyond small, clean toy datasets so that students get an insight into what a real-life dataset looks like. Finally, students also learn about open access, including some solid myth-busting with respect to APCs (more on that below).
First approach of the DOAJ dataset: clean, enrich, and analyze the data
The first way in which students approach this dataset is to investigate its contents, which requires both some cleaning up and enrichment of the data, as well as some summary statistics and/or visualization of the data it contains. For that part of the class, students primarily rely on Python’s pandas library, a powerful tool to interact with tabular data (among other things). There’s a number of things students learn to perform at this stage (roughly in order of increasing complexity):
- For columns containing a closed list of simple values, such as the country information: count how often each value occurs.
- For columns containing lists of values, such as the languages of publication: transform this data to one column per value with a binary encoding, for easier processing.
- For columns containing entities that it might be of interest to reference and identify, such as countries or languages: use pandas in combination with OpenRefine to, e.g., map country names to items in Wikidata. Then, automatically retrieve additional information on these countries that might be of interest. This might include things like on what continent they are located (to group countries), the number of universities (to get a sense of the size of their research system) or the GDP (to better interpret APC amounts).
- With respect to APC amounts: use additional libraries and interfaces to identify the currencies in which APC amounts are given, and convert them all to one specific currency, in order to make these values comparable.
- Based on this, calculate APC bands, that is: find a rational and transparent way of splitting the range of APC amounts into several categories, like low, moderate, high and very high APCs.
- Finally, with respect to columns containing relatively complex subject heading entries: Handle the complexity of lists of hierarchically-organized subject headings, for example by reducing their granularity to just the top-level categories; and again recoding this information using dummy variables and binary encoding for easier handling of the data.
Once the dataset is cleaned up and enhanced in this way, students also learn how to visualize this data, in particular using Seaborn, a visualization library with a rather friendly programming interface:
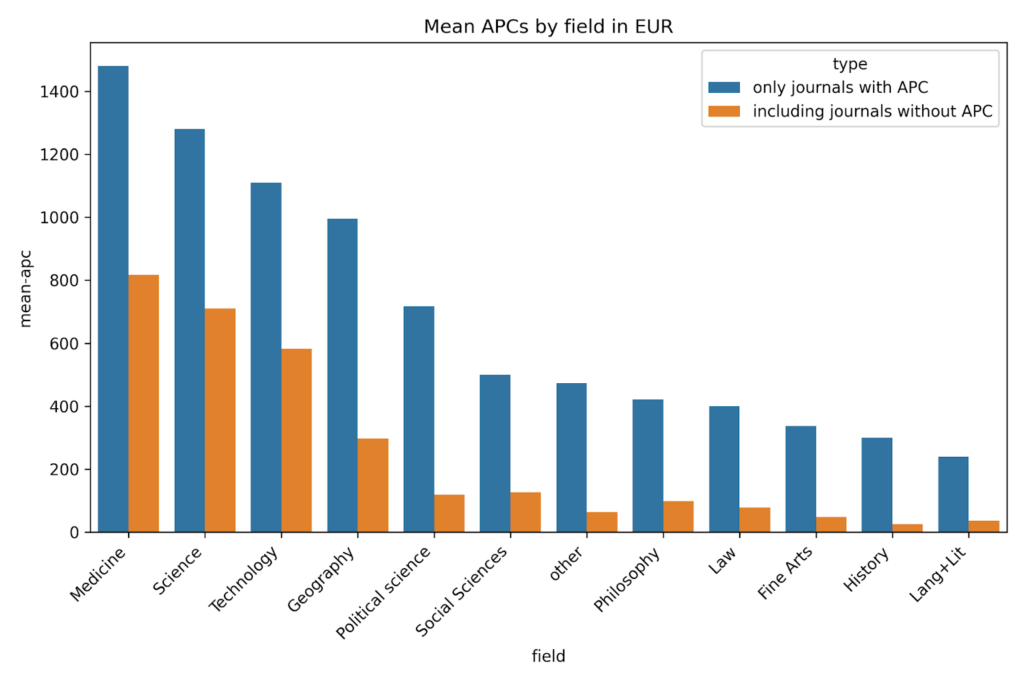
- They learn how to produce simple visual summaries of the information contained in a dataset, for example by looking at the distribution of values for the publication speed (weeks from submission to publication). What’s a typical duration, in what direction is this distribution skewed? Or the mean APC value depending on the subject keywords? (see Figure 1)
- And they learn to produce scatterplots that show the relationship between two quantitative variables, such as the number of languages of publication of a journal and the publication speed. Do publishers allowing several languages of publication need more time to publish the articles?
This step has two primary functions: Optimizing the dataset for a machine-learning-based classification task, and of course understanding the dataset, in particular the nature of the features (e.g., numerical or categorical) as well as the relationships between different features (e.g., strong or weak correlation).
Second approach to the dataset: apply a machine learning classifier to the data and predict APC levels
Based on this preliminary step of cleaning and understanding the dataset, students are then ready to learn how to perform machine learning tasks using this dataset, primarily using the very versatile and well-documented scikit-learn library for Python. There are several classification tasks that are obvious candidates for this, but we generally use the APC information as the target category and other descriptive features of journals as indicators for the APCs. Students develop hypotheses for this, based on their exploration of the data: might journals in some fields tend to charge higher APCs than others? Might journals publishing in certain countries, or in certain languages, have a tendency not to charge any APCs? Do journals that charge a particularly high APC generally publish more, and publish faster, than journals that do not? Variants of the classification task involve whether to approach this question simply as a binary classification task (does the journal charge an APC: yes or no?), or as a multi-class problem (predict the APC bands defined in the previous step) or even as a regression task (predict the actual APC amount in, say, euros).
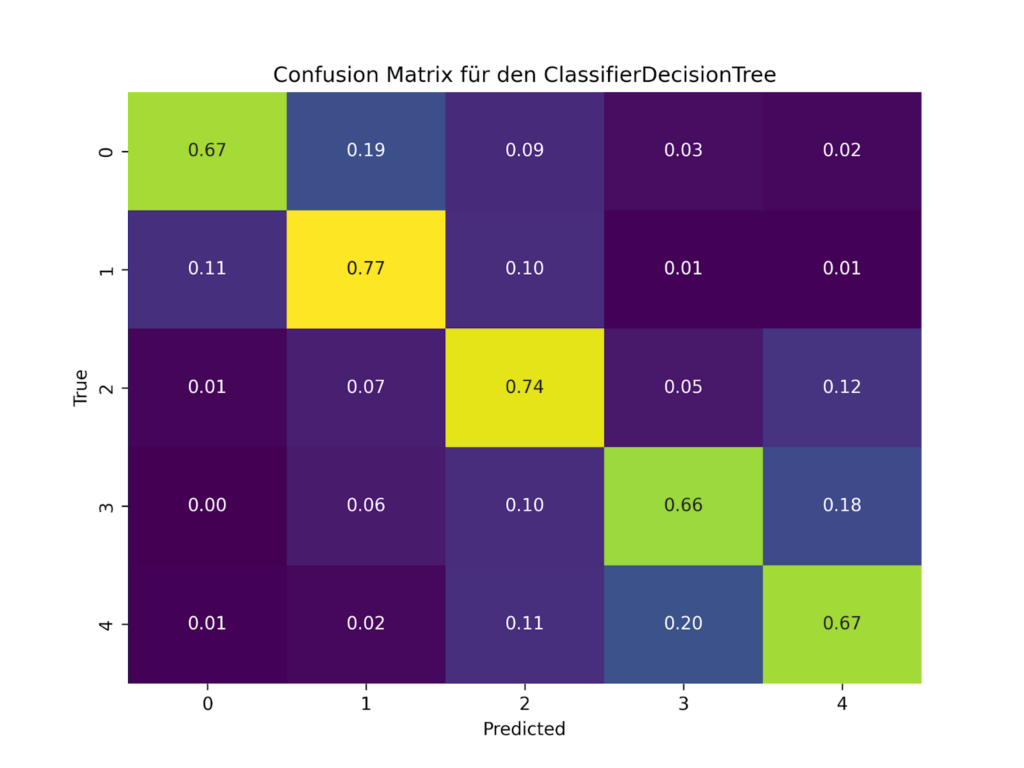
For a range of purposes, students also need to learn how to evaluate their classifiers, that is: how well do the values predicted using a given set of features and a given type of classifier agree with the values that we can actually observe in the dataset? Concepts like training and test sets as well as accuracy, precision, recall and F1-Score are essential here, as is error analysis using e.g.. a visualization of the confusion matrix (for an example, see Figure 2). Such evaluations are helpful in order to understand how certain features are actually related to the APCs, of course. They can also help determine what kinds of data normalization strategies are helpful, how class imbalances can be handled using over- or undersampling, or which type of classifier is most suited for the kind of data at hand here. These are all essential aspects of machine learning that students can explore using real-world data that are relevant to their field of study.
Added bonus: debunking some myths about open access
In the process of learning about data enhancement with pandas and classification with scikit-learn, students learn (in passing) many useful things about open access. For example, they learn when exploring the dataset that more than 60% of the journals do not, in fact, require payment of an APC while still being open access. This is an essential corrective to the widespread narrative that open access makes publishing more expensive for authors. Students also get a global, and multi-disciplinary view of the open access landscape: they discover, for example, that a large number of journals are being published in Indonesia, that Latin American open access journals rarely charge any APCs, or that many journals publish research in languages other than English. They also find out how some of these factors interact, like the relationship between certain subject areas and the level of APCs being charged. The most important thing here, however, is that they learn all of this not by being told, but by discovering it themselves.
Suggestions for improvement of the DOAJ dataset
Finally, we do have some suggestions for improvement of the dataset, based on this experience. One thing that would make using the dataset easier is the use of standard identifiers for certain things, such as countries and languages. If reliable ISO codes or Wikidata QIDs were already present, mapping to Wikidata in order to pull in additional information would be much easier. Adding a continent or ‘world region’ column would in any case be highly useful. Similarly, providing all APC values also in a mapping to one particular currency, whether that’s EUR, USD or RMB, would also make using the dataset much easier.
Finally, simpler column headings, offset by a bit more documentation (e.g., in a separate file) about what the column headings mean and how each feature is organized (for example, how the LLC Codes relate exactly to the Subjects, and how these two columns are organized), would also make things easier.
However, to tell the truth, I am really rather conflicted about suggesting those changes. They might improve the ease of use of the dataset, but for teaching purposes, these are actually good and important challenges that we need to learn how to address and solve.
Concluding remarks
Too often, students in Digital Humanities learn programming using problems and datasets they do not really care about. The DOAJ dataset, without being narrowly relevant only to computational literary studies or digital history specifically, has a direct relevance to concerns around open science that are central to the Digital Humanities. Also, this dataset is sufficiently large and complex in order to serve as a realistic case study, where data needs to be prepared and enhanced before it can actually be used, an essential experience in my opinion. In a nutshell, the DOAJ dataset simply represents a wonderful learning opportunity, not just because of its size and quality, but also and especially because of its imperfections.
Christof Schöch is Chair of Digital Humanities at the University of Trier, Germany, scientific Co-Director of the Trier Center for Digital Humanities (TCDH) and co-editor of the Journal of Computational Literary Studies (JCLS). He works at the intersection of Computational Literary Studies and the history of French literature. In the past, he has been president of the Association for Digital Humanities in the German-speaking areas (DHd, 2018–2022) and president of the international Alliance of Digital Humanities Organizations (ADHO, 2023–2024).